Beware of the Average!

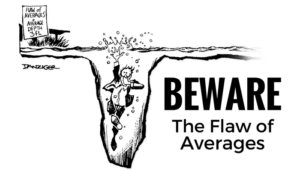
It’s been a crazy couple of weeks, so I’m just going to put up a nifty little picture.  But since I generally try to write about 1000 words, this pic ought to do the trick . . .

In case you can’t make out the sign on the river bank, it says that the average depth of the water is 3 ft!

Beware-The-Flaw-of-Averages

Sometimes an average is a useful number, but we get ourselves in some deep water if we assume that there is no variation across the range of data points from which that average emerged. Frequently, there is a lot of variation. And if that variation clusters according to another set of characteristics, then we can’t spend much time celebrating anything no matter how good that average score might seem.

Make it a good day,

Mark

Improving an Inclination toward Complex Thinking – Part III (AKA doing something with what we now know)

So far this year, the Assessment for Improvement Committee (AIC) and the Office of Institutional Research and Assessment (IRA) have hosted two Friday Conversations to explore findings from our 4-year study of intellectual sophistication growth among Augustana students. The first conversation focused on how our students changed from Welcome Week (just before freshmen start their first fall term) to graduation and how different types of students (depending on traits like race, sex, or pre-college academic preparedness), although they may have started in different places, seem to have grown about the same amount over four years (I summarized that presentation in a blog post here). The second conversation examined the different student experiences that appear to influence that change, either positively or negatively (you can read a summary of that presentation in a blog post here). Clearly, our findings suggest that the degree to which students take ideas they’ve learned in one discipline and apply them or vet them in a different disciplinary or real-world setting demonstrably increases our student’s inclination toward complex thinking.

Although the findings we’ve discussed so far are interesting in their own right, they don’t do anything by themselves to help us improve student learning. In fact, without collectively committing to do something with our results, we end up just like most organizations – chock-full of data but unable to turn those insights into actions that actually make them better. If we’re being honest, the fact that we know so much about how our students’ growth and the experiences that shape that growth puts us in the unenviable position of being almost morally obligated to do something with what we know – no matter how daunting that might be.

I know all of that sounds a little heavy-handed (ok – more than a little heavy-handed), but in the 8 years I’ve been at Augustana, the times when we’ve been at our absolute best have been when we’ve let down our defenses, humbly looked in the mirror, and chosen to believe in the best of each other. Then we’ve all put our shoulders to the plow to make the education we provide just a little bit better than it was before.

And that is the focus of the third, and most important, AIC/IRA Friday Conversation at the end of this week. After we briefly review what we have learned from our data, we will organize into smaller groups to come up with 2-4 viable ways in which we can turn these findings into action. This might take the form of professional development sessions, policy for course design or pedagogical nuance, or co-curricular emphases to apply our findings to impact a larger proportion of students.

So please come to the AIC/IRA Friday Conversation this Friday, March 23rd. We will be in the Wilson Center. Food and drinks are available at 3:30 and the conversation will start at 4:00.

We are really good at getting better. I’ve seen us do it over and over again. I, for one, can’t wait to see what we come up with!

Make it a good day,

Mark

What do students do about the textbooks and additional materials we assign?

At first, that might seem like an incredibly dumb question.  If you’re in a salty mood, you might snarl, “Buy them and learn or fail the damn course.”  For most of us, I suspect the thought of not buying the additional materials required (or even recommended) for a class might seem utterly absurd. When I was an undergraduate, I remember being warned not to buy used books because they would likely have someone else’s notes in the margins, leaving no room for me to write my own (ok, maybe not the most convincing argument). Nonetheless, I definitely remember feeling like a slacker if I didn’t show up to the first day of class with a shiny new version of each required text.

Fast forward 30-odd years and things couldn’t be more different. The cost of textbooks has risen even faster than the cost of college tuition (have a look at this graphic from the Bureau of Labor Statistics), even as the cost of recreational books has gone down.

More and more, it appears that students are renting textbooks, borrowing from friends, or just foregoing some books altogether. The Chronicle of Higher Ed highlighted a study in 2011 suggesting that 7 of 10 students have skipped buying a textbook because of cost. More recent online columns and blogs seem to perpetuate the notion, if not brag outright, that a student can succeed in college without buying books. In January, the Atlantic published a longer piece examining the reality that, despite the surge in online and other edtech resources, the cost of textbooks and/or their online equivalent remains exorbitantly high. And in the context of the financial pressures that many students experience just paying tuition, room, and board, I guess it shouldn’t surprise us much when already financially-strapped students take advantage of any alternative that might save them some money.

A few weeks ago, about forty faculty and staff gathered in the library to kickstart a conversation about Augustana students and textbooks. After discussing the financial realities of textbook costs, the conversation turned toward the ways in which we choose the textbooks and additional materials that we assign. Although this is something that we might take for granted at times (especially if one might be scrambling to put a course together), it’s an issue that more and more folks are trying to address.  I’m sure there are plenty of examples, but three impressive efforts include the Open Textbook LibraryCollege Open Textbooks, and the Open Educational Resources Commons. Most recently, 40 colleges have made the move to simply go without textbooks and only use freely available learning resources (see here and here).

At the end of the meeting, it seemed clear that we really need to know more about our student’s engagement with the textbooks and additional materials assigned in our courses. One person posed an exceedingly logical suggestion: could we add a couple of questions to the end of every IDEA course feedback survey at the end of spring term asking about:

  • The amount that students spent on textbooks for a given class
  • How often they used the textbooks and additional materials they bought for that class
  • How effective those materials were in helping the student learn in that class

It seems like this would be particularly useful information. But before acting on any of these ideas, I think it’s important to know what you all think about gathering this information, what questions you might have about what is done with this information, and any other concerns you might have about this project.

So . . . . what do you think?  Should we ask these questions?  What should we do with the data?  If we ask these questions, how do we need to be careful and transparent so that whatever we find, 1) gives us a deeper understanding of our students’ engagement with textbooks and additional materials, and 2) genuinely spurs our perpetual effort to improve in a way that fosters inclusiveness and understanding.

Please – send me your thoughts.  If you know my email, you can send them there. If you’d rather post in the comments section below, please post away.

Make it a good day,

Mark


Warming Perceptions across the Political Divide

Welcome back to campus for the headlining event – Spring Term! (about as likely a band name as anything else these days, right?).

At the very end of winter term, Inside Higher Ed published a short piece highlighting a study that suggested the first year of college might broaden students’ political views. The story reviewed findings (described in more depth here) from an ongoing national study of college students’ interfaith understanding development that goes by the acronym IDEALS (AKA, the Interfaith Diversity Experiences & Attitudes Longitudinal Survey). In essence, both politically conservative and politically liberal students (self-identified at the beginning of their first year in college) developed more positive perceptions of each other by the beginning of their second year. Since Augustana is one of the participating institutions in this study, I thought it might be interesting to see if our local data matches up with the national findings.

The IDEALS research project is designed to track change over four years, asking students to complete a set of survey questions at the beginning of the first year (fall, 2015), at the beginning of the second year (fall, 2016), and at the end of the fourth year (spring, 2019). Many of the survey questions ask individuals about their perceptions of people of different religions, races, ethnicities, and beliefs. For the purposes of this post, I’ll focus on the responses to four statements listed below and zero in on the responses from conservative students about liberal students and the responses from liberal students about conservative students.

  • In general, I have a positive attitude toward people who are politically conservative
  • In general, I have a positive attitude toward people who are politically liberal
  • In general, individuals who are politically conservative are ethical people
  • In general, individuals who are politically liberal are ethical people
  • In general, people who are politically conservative make a positive contribution to society
  • In general, people who are politically liberal make a positive contribution to society
  • I have things in common with people who are politically conservative
  • I have things in common with people who are politically liberal

For each item, the five response options ranged from “disagree strongly” to “agree strongly.”

First, let’s look at the responses from politically conservative students. The table below provides the average response score for each item at the beginning of the first year and at the beginning of the second year.

Politically Conservative Student’s Perceptions of Politically Liberal Students

Item Fall, 2015 Fall, 2016
Positive Attitudes 3.71 3.46
Ethical People 3.21 3.50
Positive Contributors 3.64 3.92
Positive Commonalities 3.23 3.29

Overall, it appears that conservative students’ perceptions of liberal students improved during the first year. Scores on two items (ethical people and positive contributors) increased substantially. Perceptions of commonalities remained essentially the same, and a self-assessment of positive attitudes toward liberal students declined. Normally, the drop in positive attitude would seem like a cause for concern, but conservative students positive attitudes toward other conservatives dropped as well, from 4.29 to 3.92. So maybe it’s just that the first year of college makes conservatives grouchy about everyone.

Second, let’s look at the responses from politically liberal students when asked to assess their perceptions of politically conservative students. Again, the table below provides the average response score for each item at the beginning of the first year and at the beginning of the second year.

Politically Liberal Student’s Perceptions of Politically Conservative Students

Item Fall, 2015 Fall, 2016
Positive Attitudes 3.61 3.65
Ethical People 3.58 3.78
Positive Contributors 3.33 3.76
Positive Commonalities 3.31 3.69

It appears that liberal students’ views of conservative students improved as well, maybe even more so. While positive attitudes about conservative students didn’t change, perceptions of conservatives as ethical people, positive contributors to society, and people with whom liberals might have things in common increased significantly.

Although the repeated gripe from conservative pundits is that colleges are a bastion of liberalism indoctrinating young minds, research (here and here) seems to contest this assertion. While the findings above don’t directly address students’ changing political beliefs, they do suggest that both politically conservative and politically liberal student’s perceptions of the other shift in a positive direction (i.e., they perceive each other more positively after the first year). This would seem to bode well for our students, our campus community, and for the communities in which they will reside after graduation. Because no matter how any of these student’s political views might change over four years in college, more positive perceptions of each other sets the stage for better interactions across differing belief systems. And that is good for all of us.

If we situate these findings in the context of a four-year period of development, I think we ought to be encouraged by these findings, no matter if we lean to the left or to the right. Maybe, even in the midst of all the Sturm und Drang we’ve experienced in the past few years, we are slowly developing students who are more equipped to interact successfully despite political differences.

Make it a good day,

Mark


What experiences improve our student’s inclination toward complex thinking?

I’ve always been impressed by the degree to which the members of Augustana’s Board of Trustees want to understand the sometimes dizzying complexities that come with trying to nudge, guide, and redirect the motivations and behaviors of young people on the cusp of adulthood. Each board member that I talk to seems to genuinely enjoy thinking about these kinds of complicated, even convoluted, challenges and implications that they might hold for the college and our students.

This eagerness to wrestle with ambiguous, intractable problems exemplifies the intersection of two key Augustana learning outcomes that we aspire to develop in all of our students. We want our graduates to have developed incisive critical thinking skills and we want to have cultivated in them a temperament that enjoys applying those analytical skills to solve elusive problems.

Last spring Augustana completed a four-year study of one aspect of intellectual sophistication. We chose to measure the nature of our students’ growth by using a survey instrument called the Need for Cognition Scale, an instrument that assesses one’s inclination to engage in thinking about complex problems or ideas. Earlier in the fall, I presented our findings regarding our students’ growth between their initial matriculation in the fall of 2013 and their graduation in the spring of 2017 (summarized in a subsequent blog post). We found that:

  1. Our students developed a stronger inclination toward thinking about complex problems. The extent of our students’ growth mirrored the growth we saw in an earlier cohort of Augustana students while participating in the Wabash National Study between 2008 and 2012.
  2. Different types of students (defined by pre-college characteristics) grew similar amounts, although not all students started and finished with similar scores. Specifically, students with higher HS GPA or ACT/SAT scores started and finished with higher Need for Cognition scores than students with lower HS GPA or ACT/SAT scores.

But, as with any average change-over-time score, there are lots of individual cases scattered above and below that average. In many ways, that is often where the most useful information is hidden. Because if the individuals who produce change-over-time scores above, or below, the average are similar to each other in some other ways, teasing out the nature of that similarity can help us figure out what we could do more of (or less of) to help all students grow.

At the end of our first presentation, we asked for as many hypotheses as folks could generate involving experiences that they thought might help or hamper gains on the Need of Cognition Scale. Then we went to work testing every hypothesis we could possibly test. Taylor Ashby, a student working in the IR office, did an incredible job taking on this monstrous task. After several months of pulling datasets together, constructing new variables to approximate many of the hypotheses we were given, and running all kinds of statistical analyses, we found a couple of pretty interesting discoveries that could help Augustana get even better at developing our student’s inclination or interest in thinking about complex problems or ideas.

To help us organize all of the hypotheses that folks suggested, we organized them into two categories: participation in particular structured activities (e.g., being in the choir or completing a specific major) and experiences that could occur across a range of situations (e.g., reflecting on the impact of one’s interactions across difference or talking with faculty about theories and ideas).

First, we tested all of the hypotheses about participation in particular structured activities. We found five specific activities to produce positive, statistically significant effects:

  • service learning
  • internships
  • research with faculty
  • completing multiple majors
  • volunteering when it was not required (as opposed to volunteering when obligated by membership in a specific group)

In other words, students who did one or more of these five activities tended to grow more than students who did not. This turned out to be true regardless of the student’s race/ethnicity, sex, socioeconomic status, or pre-college academic preparation. Furthermore, each of these experiences produced a unique, statistically significant effect when they were all included in the same equation. This suggests the existence of a cumulative effect: students who participated in all of these activities grew more than students who only participate in some of these activities.

Second, we tested all of the hypotheses that focused on more general experiences that could occur in a variety of settings. Four experiences appeared to produce positive, statistically significant effects.

  • The frequency of discussing ideas from non-major courses with faculty members outside of class.
  • Knowledge among faculty in a student’s major of how to prepare students to achieve post-graduate plans.
  • Faculty interest in helping students grow in more than just academic areas.
  • One-on-one interactions with faculty had a positive influence on intellectual growth and interest in ideas.

In addition, we found one effect that sort of falls in between the two categories described above. Remember that having a second major appeared to produce a positive effect on the inclination to think about complex problems or ideas? Well, within that finding, Taylor discovered that students who said that faculty in their second major emphasized applying theories or concepts to practical problems or new situations “often” or “very often” grew even more than students who simply reported a second major.

So what should we make of all these findings? And equally important, how do we incorporate these findings into the way we do what we do to ensure that we use assessment data to improve?

That will be the conversation of the spring term Friday Conversation with the Assessment for Improvement Committee.

Make it a good day,

Mark
Should the male and female college experience differ?

The gap between males and females at all levels of educational attainment paints a pretty clear picture. Males complete high school at lower rates than females. Of those who finish high school, males enroll in college at lower rates than females. This pattern continues in college, where men complete college at lower rates than women. Of course, some part of the gap in college enrollment is a function of the gap in high school completion, and some part of the gap in college completion is a function of the gap in college enrollment. But overall, it still seems apparent that something troubling is going on with boys and young men in terms of educational attainment. Yet, looking solely at these outcome snapshots does very little to help us figure out what we might do if we were going to reverse these trends.

A few weeks ago, I dug into some interesting aspects of the differences in our own male and female enrollment patterns at Augustana, because understanding the complexity of the problem is a necessary precursor to actually solving it. In addition, last year I explored some differences between men and women in their interest in social responsibility and volunteering behaviors. Today, I’d like to share a few more differences that we see between male and female seniors in their responses to senior survey questions about their experience during college.

Below I’ve listed four of the six senior survey questions that specifically address aspects of our students’ co-curricular experience. In each case, there are five response options ranging from strongly disagree (1) to strongly agree (5). Each of the differences shown below between male and female responses is statistically significant.

  • My out-of-class experiences have helped me connect what I learned in the classroom with real-life events.
    • Men     –    3.86
    • Female –    4.17
  • My out-of-class experiences have helped me develop a deeper understanding of myself.
    • Men     –    4.10
    • Female –    4.34
  • My out-of-class experiences have helped me develop a deeper understanding of how I interact with someone who might disagree with me.
    • Men     –    4.00
    • Female –    4.28
  • My co-curricular involvement helped me develop a better understanding of my leadership skills.
    • Men     –    4.14
    • Female –    4.35

On one hand, we can take some comfort in noting that the average responses in all but one case equate with “agree.” However, when we find a difference across an entire graduating class that is large enough to result in statistical significance we need to take, at the very least, a second look.

Why do you think these differences are appearing in our senior survey data? Is it just a function of the imprecision that comes with survey data? Maybe women tend to respond in rosier terms right before graduation than men? Or maybe there really is something going on here that we need to address. One way to test that possibility is to ask whether or not there might be other evidence that corroborates these findings, be it anecdotal or otherwise qualitative. Certainly, the prior evidence I’ve noted and linked above should count some, but that data also comes from senior survey data.

Recent research on boys and young men seems to suggest that these differences in our data may not be a surprise (check out the books Guyland (I found a free pdf of the book!) and Angry White Men or a Ted Talk by Philip Zimbardo for a small sample of the scholarship on men’s issues). This growing body of scholarship also suggests that differences that we might see between males and females begin to emerge long before college, but it also suggests that we are not powerless to reverse some of the disparity.

At the board meetings this weekend, we will be talking about some of these issues. In the meantime, what do you think? And if you think that these differences in our data ought to be taken seriously, does it mean that we ought to construct educationally appropriate variations in the college experience for men and women?

I’d love to read what you think as you chew on this.

Make it a good day,

Mark

Anticipating what our students need to know is SO complicated!

Over the last few weeks, I’ve been wrestling with a couple of data trends and their accompanying narratives that seem pretty important for colleges like ours. However, unlike most posts in which I pretend to have some answers, this time I’m just struggling to figure out what it all means. So this week, I’m going to toss this discombobulated stew in your lap and hope you can help me sort it all out (or at least clean up some of the mess!).

First, the pressure on colleges to prepare their students to graduate with substantial “work readiness” appears to be at an all-time high. The Gallup Organization continues to argue that employers don’t think college graduates are well-prepared for success in the workplace. Even though there is something about the phrase “work readiness” that makes me feel like I just drank sour milk, we have to admit that preparing students to succeed in a job matters, especially when student loan debt is now such a large, and often frightening, part of the calculus that determines if, and where, a family can send their kids to college. Put all this together and it’s no wonder why students overwhelmingly say that the reason they want to go to college is to get a good-paying job.

Underneath all of this lies a pretty important assumption about what the world of work will be like when these students graduate. Student loans take, on average, 21 years to pay off, and the standard repayment agreement for a federal student loan is a 10-year plan. So it would seem reasonable that students, especially those who take out loans to pay for college, would anticipate that the job for which college prepares them should in most cases outlast the time it takes for them to pay off their loans. I’m not saying that everyone thinks this through completely, but I think most folks are assuming a degree of stability and income in the job they hope to obtain after earning a college degree, making the loans that they take out to pay for college a pretty safe bet.

But this is where it gets dicey. The world of work has been undergoing a seismic shift over the past several decades. The most recent report from the Bureau of Labor Statistics suggests that, on average, a person can expect to have 12 jobs between the ages of 18 and 50. What’s more, the majority of those job changes occur between the ages of 18 and 34 – the same period of time during which one would be expected to pay off a student loan. Moreover, between 2005 and 2015, almost all of the jobs added to the economy fit into a category called “alternative work.” This category of work includes contract labor, independent work, and any sort of temporary job (in addition to the usual suspects, think Turo, Lyft, or TaskRabbit). Essentially, these are jobs that are either spun as “providing wonderful flexibility” or depressingly described as depending on “the whim of the people.” As with so many other less-than-attractive realities, someone put a bow on it and labeled this whole movement “the gig economy” (sounds really cool except there’s no stage lighting or rock and roll glamor). It’s no surprise that the gig economy presents a rather stark set of downsides for individuals who choose it (or get sucked into it by circumstances beyond their control).

So what does all of this mean for colleges like ours that are (whether we like it or not) obligated to focus a lot of our attention on preparing students for a successful professional life?  I don’t have many great answers to this one. But a couple of questions seem pretty important:

  • To what degree are we responsible for ensuring that our students are financially literate and can manage through the unpredictability that seems likely for many early in their career?
  • What knowledge, skills, or dispositions should we prioritize to help our students thrive in a professional life that is almost certain to include instability, opportunity, and unexpected change?

Of all the possible options that an 18-year-old could sign up for, a small liberal arts college seems like it ought to be the ideal place for learning how to navigate, even transcend, the turbulent realities that seem more and more an unavoidable part of the world of work. But without designing what we do so that every student has to encounter this stuff, we leave that learning up to chance. And as usual, the students who most need to learn this stuff are the ones who are least likely to find it on their own.  Looks like we better role up our sleeves and get to work!

Make it a good day,

Mark

Sometimes you find a nugget where you least expect it

As many of you already know, data from the vast majority of the college ranking services is not particularly applicable to improving the day-to-day student experience. In many cases, this is because those who construct these rankings rely on “inputs” (i.e., information about the resources and students that come to the institution) and “outputs” (i.e., graduation rates and post-graduate salaries) rather than any data that captures what happens while students are actually enrolled in college.

But just recently I came across some of the data from the Wall Street Journal/Times Higher Education College Rankings that surprised me. Although this ranking is still (in my opinion) far too dependent on inputs and outputs, 20% of their underlying formula comes from a survey of current students. In this survey, they ask some surprisingly reasonable questions about the college experience, the responses to which might provide some useful information for us.

Here is a list of those questions, with the shortened label that I’ll use in the table below bolded within each question.

  • To what extent does your college or university provide opportunities for collaborative learning?
  • To what extent does the teaching at your university or college support critical thinking?
  • To what extent does the teaching at your university or college support reflection upon, and making connections among, things you have learned?
  • To what extent does the teaching at your university or college support applying your learning to the real world?
  • To what extent did the classes you took in your college or university so far challenge you?
  • If a friend or family member were considering going to university, based on your experience, how likely or unlikely are you to recommend your college or university to them?
  • Do you think your college is effective in helping you to secure valuable internships that prepare you for your chosen career?
  • To what extent does your college or university provide opportunities for social engagement?
  • Do you think your college provides an environment where you feel you are surrounded by exceptional students who inspire and motivate you?
  • To what extent do you have the opportunity to interact with the faculty and teachers at your college or university as part of your learning experience?

Below is a table of average responses comparing the average responses of Augustana students with average responses from students at other US institutions. Although I haven’t been able to confirm it by checking the actual survey, it appears that the response options for each item consist of a 1-10 scale on which the participant can plot their response to each question.

Question Augustana Average Response Top US Institution Response 75th Percentile US Institution Response Median US Institution Response 25th Percentile US Institution Response Bottom US Institution Response
Collaborative Learning 8.5 9.5 8.4 8.1 7.7 6.7
Critical Thinking 8.8 9.6 8.7 8.3 8.0 7.1
Connections 8.5 9.4 8.5 8.2 7.9 7.0
Applying Learning 8.4 9.4 8.5 8.1 7.8 6.8
Challenge 8.2 9.4 8.6 8.3 8.0 7.2
Recommend 8.6 9.8 8.7 8.3 7.8 6.7
Prepare 8.3 9.4 8.3 7.8 7.4 6.2
Social 8.9 9.7 8.7 8.5 8.1 7.2
Inspire 8.0 9.3 8.1 7.7 7.2 6.0
Interact 9.3 10.0 9.2 8.9 8.4 7.3

Two things stand out to me in the table above. First, our students’ average responses compare quite favorably to the average responses from students at other institutions.  On six of the ten items, Augustana’s average student response equaled or exceeded the 75th percentile of all US institutions. On three of the remaining four items, Augustana students’ average response fell just short of the 75th percentile by a tenth of a point.

Second, our student’s response to one question – the degree to which they felt challenged by the classes they have taken so far – stands out like a sore thumb. Unlike the rest of the data points, Augustana’s average student response falls a tenth of a point below the median of all US institutions. Compared to the relative strength of all our other average response scores, the “challenge” score seems . . . curious.

Before going any further, it’s important to take into account the quality of the data that was used to generate these averages. The Wall Street Journal/Times says that they got responses from over 200,000 students, so if they want to make claims about overall average responses they’d be standing on pretty solid ground. However, they are trying to compare individual institutions against one another, so what matters is how many responses they received from students at each institution and to what degree those responses might represent all students at each institution. Somewhere in the smaller print farther down the page that explains their methodology, they state that in most cases they received between 50-100 responses from students at each institution (institutions with fewer than 50 responses were not included in their rankings). Wait, what? Given the total enrollments at most of the colleges and universities included in these rankings, 100 responses would represent less than 10% of all students at most of these institutions – in many cases far less than 10%. So we ought to approach the comparative part results with a generous dose of skepticism.

However, it doesn’t mean that we should dismiss the entirety of this data outright. In my mind, the findings from our own students ought to make us very curious. Why would data from a set of about 100 Augustana students (we received responses from 87 students who, upon further examination, turn out to be mostly first-year, female, pretty evenly scattered across different intended majors, and are almost all from the state of Illinois) produce such a noticeable gap between all of the other items on this survey and the degree to which our students feel challenged by their courses?

This is exactly why I named this blog “Delicious Ambiguity.” This is messy data. It definitely doesn’t come with a pre-packaged answer. One could point out several flaws in the Augustana data set (not to mention the entirety of this ranking system) and make a reasonable case to dismiss the whole thing. Yet, it seems like there is something here that isn’t nothing. So the question I’d ask you is this: are there other things going on at Augustana that might increase the possibility that some first-year students would not feel as challenged as they should? Remember, we aren’t talking about a dichotomy of challenged or not challenged. We are talking about degrees of quality and nuance that is the lifeblood of improving an already solid institution.

Make it a good day,

Mark

Measures, Targets, and Goodhart’s Law

Tis the season to be tardy, fa-la-la-la-la…la-la-la-la!

I’m reasonably jolly, too, but this week seems just a little bit rushed. Nonetheless, ya’ll deserve something decent from Delicious Ambiguity this week, so I’m going to put forth my best effort.

I stumbled across an older adage last weekend that seems remarkably apropos given my recent posts about retention rates at Augustana. This phrase is most often called “Goodhart’s Law,” although the concept has popped up in a number of different disciplines over the last century or so.

“When a measure becomes a target, it ceases to be a good measure.”

You can brush up on a quick summary of this little nugget on Wikipedia here, but if you want to have more fun I suggest that you take the time to plunge yourself into this academic paper on the origin of the idea and its subsequent applications here.

Although Goodhart’s Law emerges in the context of auditing monetary policy, there are more than a few well-written examples of its application to higher ed. Jon Boekenstedt at DePaul University lays out a couple of great examples here that we still see in the world of college admissions.  In all of the instances where Goodhart’s Law has produced almost absurd results (hilarious if they weren’t so often true), the take away is the same. Choosing a metric (a simple outcome) to judge the performance (a complex process) of an organization sets in motion behaviors by individuals within that organization that will inevitably play to the outcome (the metric) rather than the performance (the process) and, as a result, corrupt the process that was supposed to lead to that outcome.

So when we talk about retention rates, let’s remember that retention rates are a proxy for the thing we are actually trying to achieve.  We are trying to achieve student success for all students who enroll at Augustana College, and we’ve chosen to believe that if students return for their second year, then they are succeeding.

But we know that life is a lot more complicated than that. And scholars of organizational effectiveness note that organizations are less likely to fall into the Goodhart’s Law trap if they identify measures that focus on underlying processes that lead to an outcome (one good paper on this idea is here). So, even though we shouldn’t toss retention rates onto the trash heap, we are much more likely to truly accomplish our institutional mission if we focus on tracking the processes that lead to student success; processes that are also, more often than not, likely to lead to student retention.

Make it a good holiday break,

Mark

Two numbers going in the right direction. Are they related?

It always seems like it takes way too long to get the 10th-day enrollment and retention numbers for the winter term. Of course, that is because the Thanksgiving holiday pushes the whole counting of days into the third week of the term and . . . you get the picture.  But now that we’ve got those numbers processed and verified, we’ve got some good news to share.

Have a look at the last four years of fall-to-winter term retention rates for students in the first-year cohort –

  • 14/15 – 95.9%
  • 15/16 – 96.8%
  • 16/17 – 96.7%
  • 17/18 – 97.4%

What do those numbers look like to you? Whatever you want to call it, it looks to me like something good. Right away, this improvement in the proportion of first-year students returning for the winter term equates to about $70,000 in net tuition revenue that we wouldn’t have seen had this retention rate remained the same over the last four years.

Although stumbling onto a positive outcome (albeit an intermediate one) in the midst of producing a regular campus report makes for a good day in the IR office, it gets a lot better when we can find a similar sequence of results in our student survey data. Because that is how we start to figure out which things that we are doing to help our students correlate with evidence of increased student success.

About six weeks into the fall term, first-year students are asked to complete a relatively short survey about their experiences so far. Since this survey is embedded into the training session that prepares these students to register for winter classes, the response rate is pretty high. The questions in the survey focus on the academic and social experiences that would help a student acclimate successfully. One of those items, added in 2013, asks about the degree to which students had access to grades or other feedback that allowed them to adjust their study habits or seek help as necessary. In previous years, we’ve found this item to correlate with students’ sense of how hard they work to meet academic expectations.

Below I’ve listed the proportion of first-year students who agree or strongly agree that they had access to the sufficient grades or feedback during their first term. Compare the way this data point changes over the last four years to the fall-to-winter retention rates I listed earlier.

  • 14/15 – 39.6%
  • 15/16 – 53.3%
  • 16/17 – 56.4%
  • 17/18 – 75.0%

Obviously, both of these data points trend in the same direction over the past four years. Moreover, both of these trends look similar in that they jump a lot between the 1st and 2nd year, remain relatively flat between the 2nd and 3rd year, and jump again between the 3rd and 4th year.

I can’t prove that improved early academic feedback is producing improved fall-to-winter term retention. The evidence that we have is correlational, not causal. But we know enough to know that an absence of feedback early in the term hurts those students who either need to be referred for additional academic work or need to be shocked into more accurately aligning their perceived academic ability with their actual academic ability. We began to emphasize this element of course design (i.e., creating mechanisms for providing early term feedback about academic performance) because other research on student success (as well as our own data) suggested that this might be a way to improve student persistence.

Ultimately, I think it’s fair to suggest that something we are doing more often may well be influencing our students’ experience. At the very least, it’s worth taking a moment to feel good about both of these trends. Both data points suggest that we are getting better at what we do.

Make it a good day,

Mark